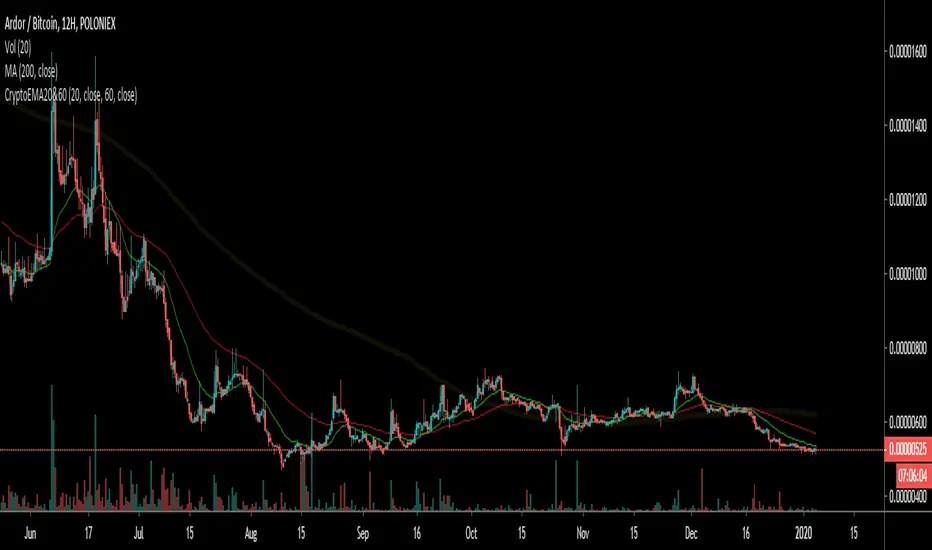
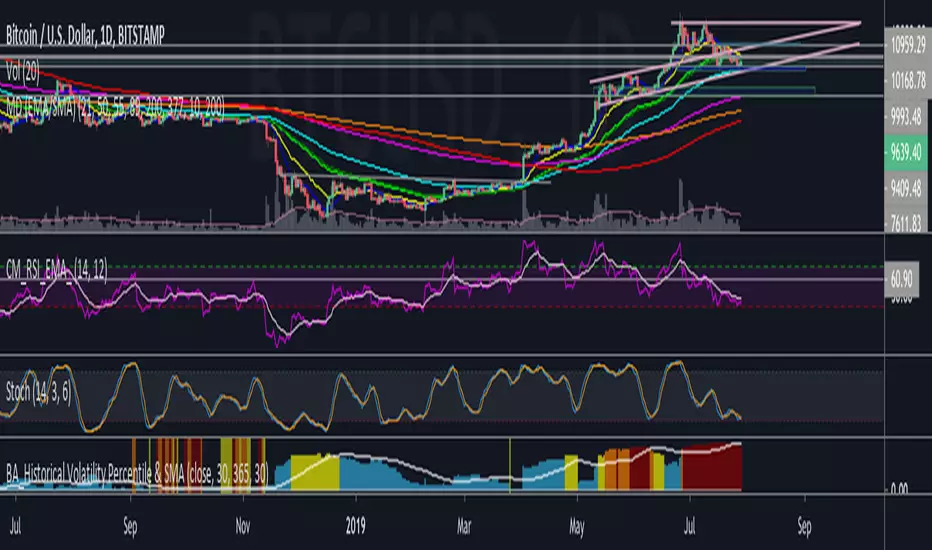
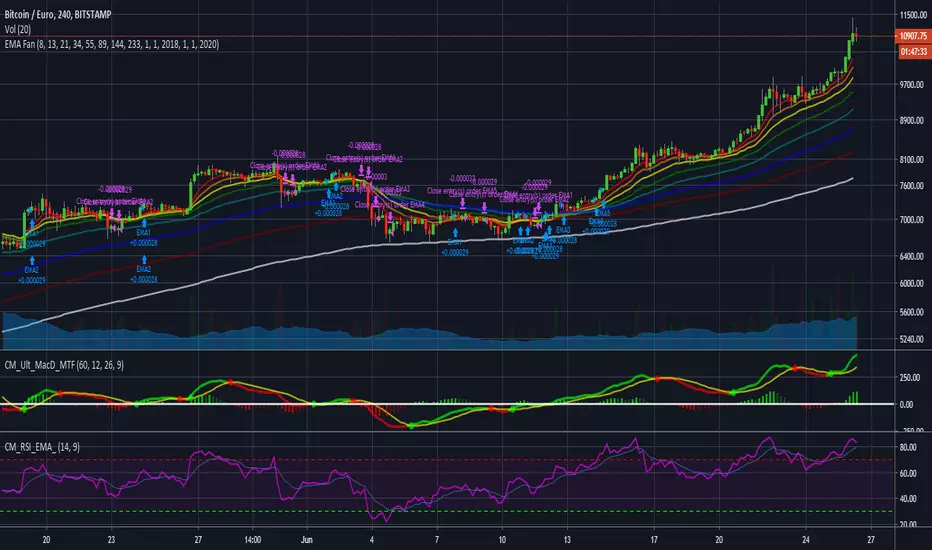
Crypto EMA 60/20Intended for use with Cryptocurrency Markets on the 12 hour time frame, the 60/20 exponential moving average frequency has proven successful for identifying trend bottom formations and for verifying head and shoulders top formations.
Combine the Crypto EMA 60/20 with classical RSI and MACD divergences to help verify impending reversals.
Useful for identifying trend changes in the frequency of four to six month price trends followed by a four to six week reversal, as historically found in cryptocurrency bull and bear markets.
This signal gets noisy if prices trend sideways for more than 30 days - consult daily views.
Cerca negli script per "3 ema"
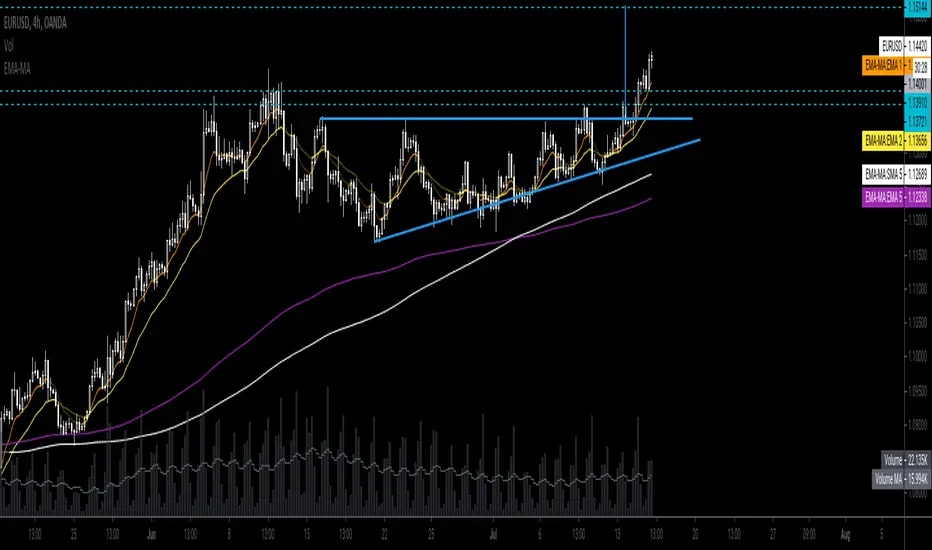
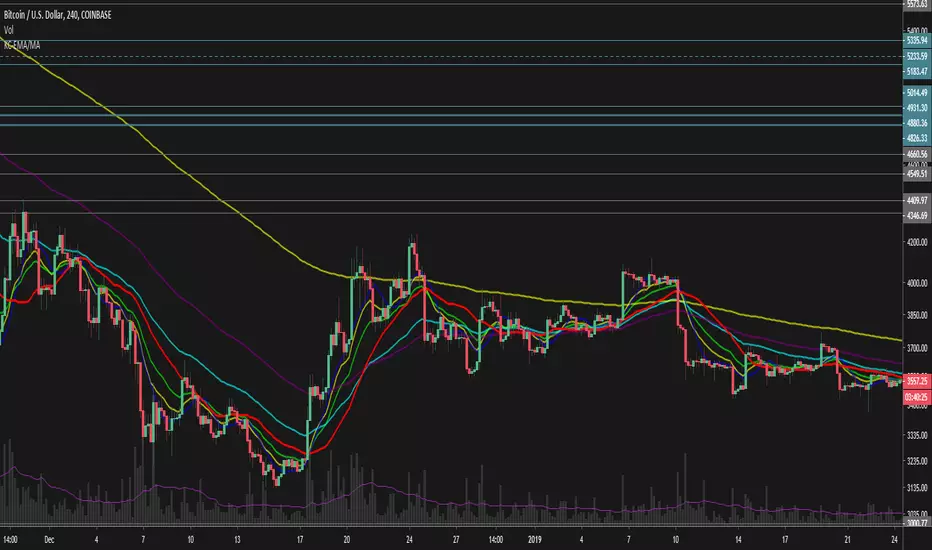
EMA/MA ComboThis is a simple combined EMA/MA indicator that also identifies the slope of the moving averages.
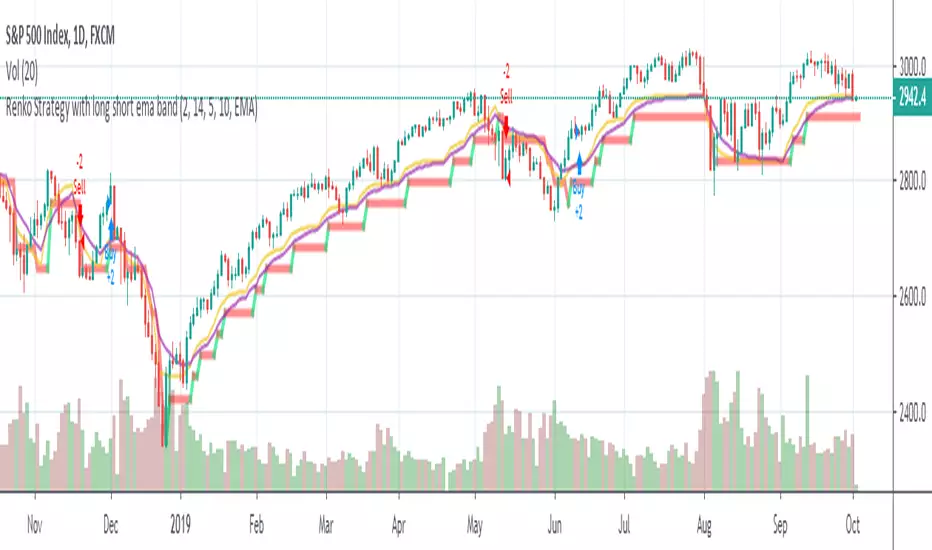
Renko Strategy with Ema against price crossover/underRenko Strategy with Ema against price crossover/under
Trend-Corrected EMAEMA is a lagging indicator, but we can do better by correcting it with its first and second derivative, which may be more theoretically sound than how DEMA and TEMA are trying to achieve the same.


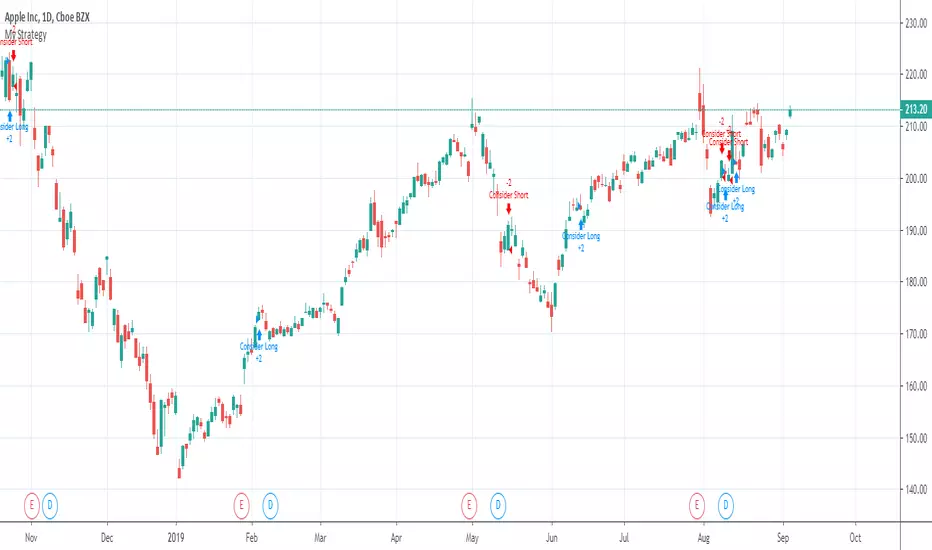
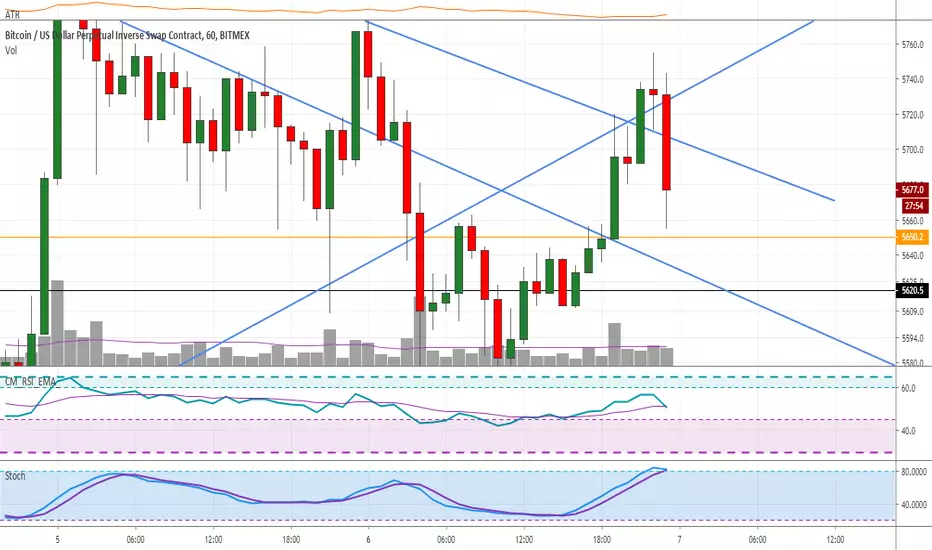
8 On 34 ema'sHi guy's
this simple dude send nice message
consider short/long when 8Ema Cross 34 Ema - If you learn this sutep and clear the false alarms (thats why it's - "consider") you can ride some waves
Enjoy

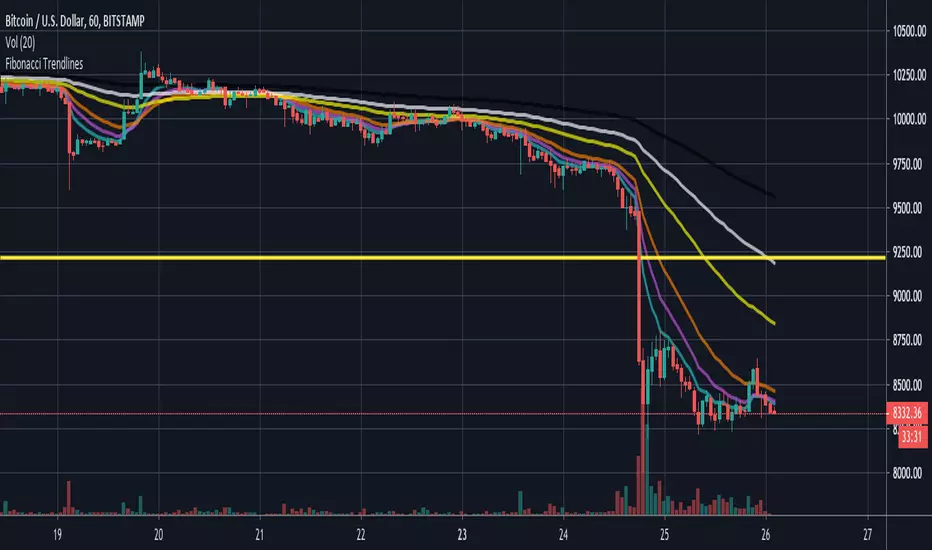
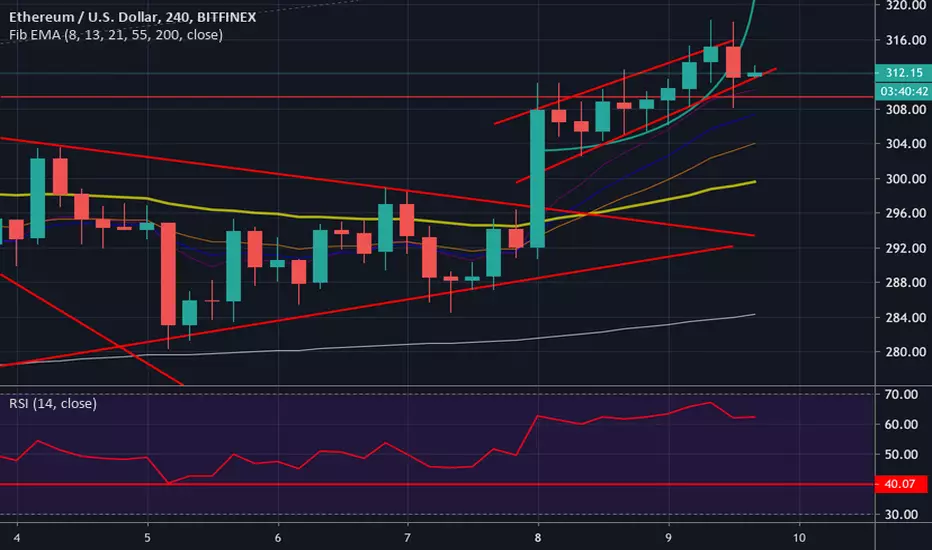
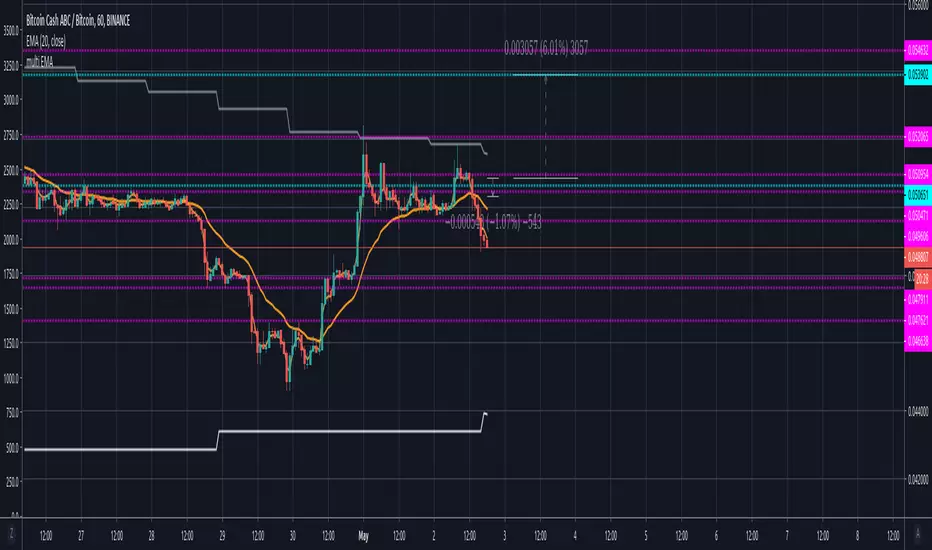
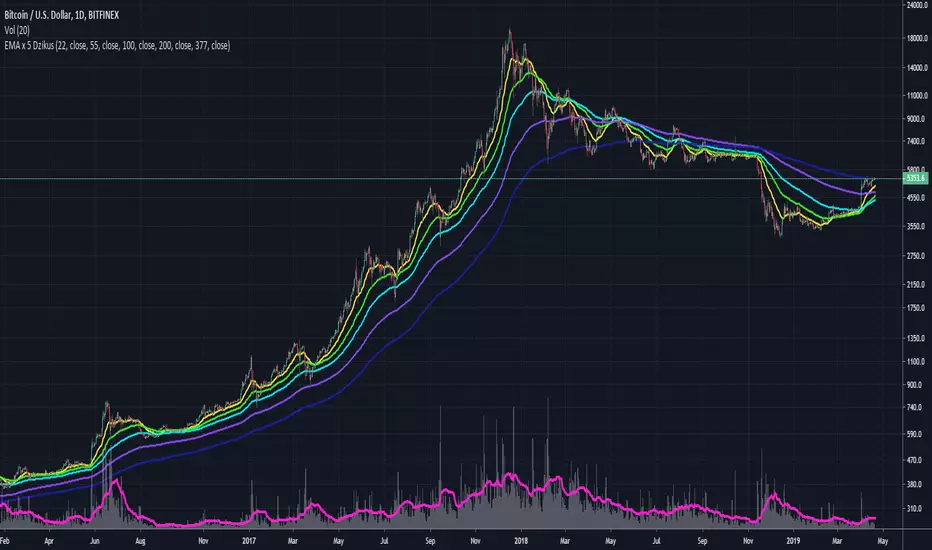
4 Fibonacci EMAsAdd 4 Fibonacci EMAs to your charts with one indicator.
Configureable by value, so they don't necessarily have to use Fibonacci numbers, and by colors.

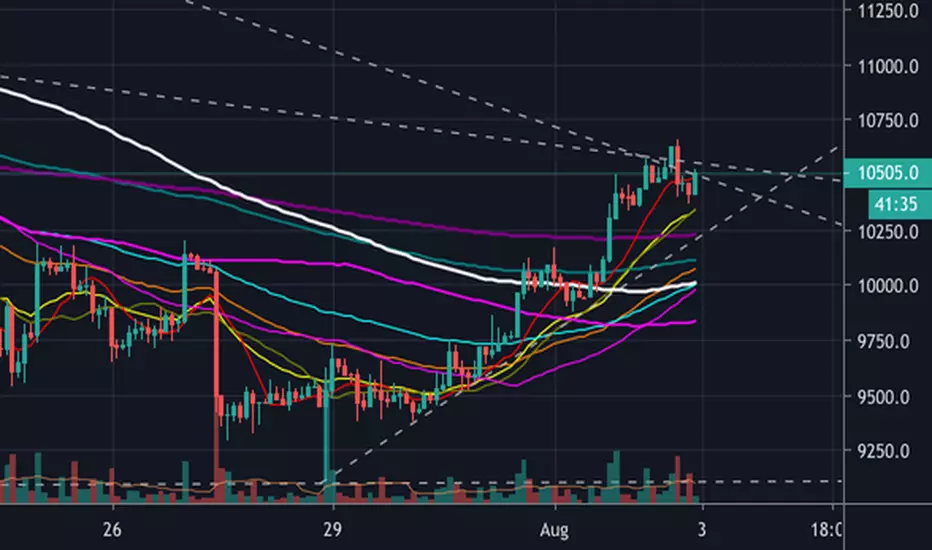
ck - 10 MA Combo (5 EMAs, 5 SMAs)Yet another MA and EMA indicator.
These are my favourite presets & colour combos for Tradingview Dark Theme.
Enjoy!


Rubbeon 8 EMA Esse indicador, consiste em um conjunto de EMAs nos valores de 20 a 50 com intervalos de 5 em 5 periodos

High Timeframe SMA & EMAThis indicator adds daily and weekly SMA & EMA to whatever your current timeframe is.

